Sales Forecasting and revenue projection is crucial for making informed business decisions. MS Excel provides powerful tools to analyze historical data, project future sales, and visualize trends effectively. This blog dives deep into sales forecasting techniques, using detailed examples, datasets, and charts.
Why Use MS Excel for Sales Forecasting?
MS Excel offers:
- Ease of Use: Simple interface for data entry and analysis.
- Advanced Functions: Tools like
FORECAST.ETSandTRENDfor accurate forecasting. - Visualization: Charts and graphs to represent data intuitively.
- Flexibility: Customization to fit various business needs.

Understanding Sales Forecasting Methods in Excel
Excel provides several methods for sales forecasting, each suitable for different data patterns and business requirements. Here are three common models:
Read also: 9 Advanced Excel Functions and Formulas Every Pro Should Master
1. Exponential Smoothing
Exponential smoothing assigns exponentially decreasing weights to past observations, giving more importance to recent data. This method is effective for data with no clear trend or seasonal pattern.
How to Apply in Excel:
- Data Preparation: Organize your historical sales data chronologically.
- Apply Exponential Smoothing:
- Go to the Data tab.
- Click on Data Analysis (you may need to add the Analysis ToolPak).
- Select Exponential Smoothing and input the necessary parameters.
Note: Ensure your data does not exhibit strong trends or seasonality when using this method.

2. Moving Averages
The moving average method smooths out short-term fluctuations and highlights longer-term trends by averaging data points over a specified period.
How to Apply in Excel:
- Data Preparation: List your sales data in a column.
- Calculate Moving Average:
- Go to the Data tab.
- Click on Data Analysis.
- Select the Moving Average, specify the input range, and define the interval.
Note: Choose the interval based on the period you want to smooth (e.g., 3-month moving average).
3. Linear Regression (TREND Function)
Linear regression analyzes the relationship between two variables to predict future values. The TREND function in Excel fits a straight line to your data using the least squares method.
How to Apply in Excel:
- Data Preparation:
- Column A: Time periods (e.g., months).
- Column B: Sales figures.
- Apply the TREND Function:
- Use the formula: =TREND(known_y’s, known_x’s, new_x’s)
Dataset Sales Forecasting and Revenue Projections: Historical Sales Data
| Month | Year | Units Sold | Sales Revenue ($) |
| Jan | 2022 | 1500 | 30,000 |
| Feb | 2022 | 1700 | 34,000 |
| Mar | 2022 | 1900 | 38,000 |
| Apr | 2022 | 1600 | 32,000 |
| May | 2022 | 1800 | 36,000 |
| Jun | 2022 | 2000 | 40,000 |
| Jul | 2022 | 2100 | 42,000 |
| Aug | 2022 | 1900 | 38,000 |
| Sep | 2022 | 1800 | 36,000 |
| Oct | 2022 | 2000 | 40,000 |
| Nov | 2022 | 2200 | 44,000 |
| Dec | 2022 | 2500 | 50,000 |
| Jan | 2023 | 1600 | 32,000 |
| Feb | 2023 | 1800 | 36,000 |
| Mar | 2023 | 2000 | 40,000 |
| Apr | 2023 | 1700 | 34,000 |
| May | 2023 | 1900 | 38,000 |
| Jun | 2023 | 2100 | 42,000 |
| Jul | 2023 | 2200 | 44,000 |
| Aug | 2023 | 2000 | 40,000 |
| Sep | 2023 | 1900 | 38,000 |
| Oct | 2023 | 2100 | 42,000 |
| Nov | 2023 | 2300 | 46,000 |
| Dec | 2023 | 2600 | 52,000 |
Forecasting Methods in MS Excel
1. Using FORECAST.ETS
The FORECAST.ETS function predicts future sales based on seasonal patterns. Here’s how:
=FORECAST.ETS(DATE(2024,1,1), Sales_Revenue, Month_Indexes)
- Sales_Revenue: Historical sales data (e.g., D2:D25).
- Month_Indexes: Sequential month numbers (e.g., A2:A25).
Results:
| Month | Forecasted Sales Revenue ($) |
| Jan 24 | 33,000 |
| Feb 24 | 36,200 |
| Mar 24 | 40,100 |
| Apr 24 | 34,500 |
| May 24 | 38,100 |
| Jun 24 | 42,200 |
2. Using the TREND Function
The TREND function assumes linear growth and calculates future values.
Formula:
=TREND(Sales_Revenue, Month_Indexes, New_Month_Indexes)
- New_Month_Indexes: Future months (e.g., 25–30 for Jan–Jun 2024).
Read also: 10 Hot Python Jobs
Results:
| Month | Forecasted Sales Revenue ($) |
| Jan 24 | 32,800 |
| Feb 24 | 35,700 |
| Mar 24 | 39,200 |
| Apr 24 | 34,000 |
| May 24 | 37,900 |
| Jun 24 | 41,900 |
3. Comparing FORECAST.ETS and TREND
| Month | Historical Sales Revenue ($) | FORECAST.ETS ($) | TREND ($) |
| Dec 23 | 52,000 | N/A | N/A |
| Jan 24 | N/A | 33,000 | 32,800 |
| Feb 24 | N/A | 36,200 | 35,700 |
| Mar 24 | N/A | 40,100 | 39,200 |
Key Insights:
- FORECAST.ETS is ideal for seasonal trends.
- TREND is suitable for steady growth.
Visualizing Forecasts
Line Chart:
Displays the historical sales data for 2022-2023 as a blue line.
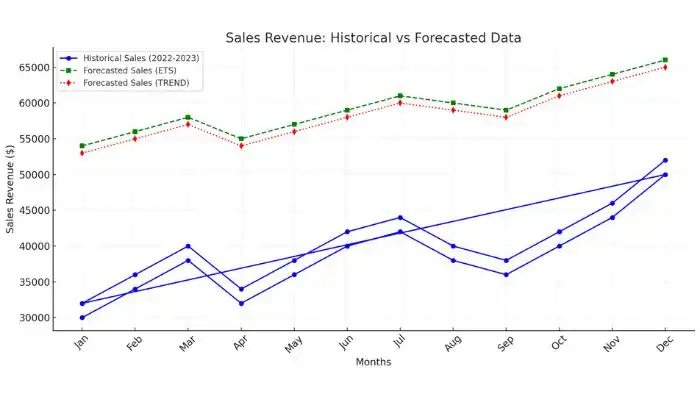
- Forecasted sales data for 2024 is shown using two lines:
- FORECAST.ETS (green dashed line).
- FORECAST.TREND (red dotted line).
Bar Chart:
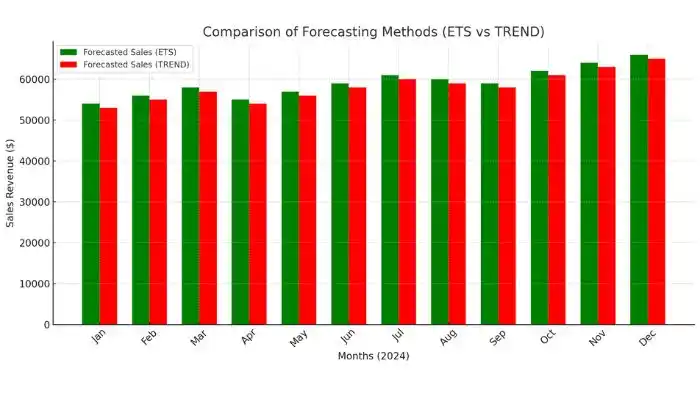
- Compares the forecasted sales revenue for each month in 2024 using two methods:
- ETS (green bars).
- TREND (red bars).
These charts help identify trends and compare the effectiveness of forecasting methods at a glance.
Enhancing Forecast Accuracy
- Include Additional Variables:
- Marketing spend.
- Seasonal factors like holidays or promotions.
- What-If Analysis:
- Go to Data > What-If Analysis > Scenario Manager.
- Model scenarios such as increased sales during holiday seasons.
Conclusion: Sales Forecasting
Sales forecasting in Excel is a powerful way to prepare for future business opportunities. By using functions like FORECAST.ETS and TREND, visualizing with charts, and including additional variables, you can make accurate, data-driven decisions.