Power BI DAX: The world of technology moves fast—Data Analytics, Programming, and Computer Science are no longer niche skills but essential tools for career growth. Whether you’re a student grappling with complex concepts, a professional looking to stay competitive, or a business leader aiming to future-proof your team, mastering these disciplines can open doors to new opportunities.
But where do you start? How do you move from theory to real-world application? With over 28 years of experience in tech education, I’ve seen firsthand how structured, hands-on learning can bridge the gap between knowledge and success. From Data Structures & Algorithms to AI-driven analytics, the right training doesn’t just teach—it transforms.
In this post, we’ll explore how building expertise in these high-demand areas can accelerate your career—and how to do it effectively.

What is Power BI DAX?
DAX (Data Analysis Expressions) is the formula and expression language used in:
- Power BI
- Excel Power Pivot
- SQL Server Analysis Services (SSAS)
It helps perform calculations, aggregations, and custom logic on data models.
⚠️ DAX ≠ Excel formulas
DAX is context-aware, highly efficient, and works directly within the data model layer.
Why Use DAX?
Without DAX, Power BI is like a luxury car without an engine. You can load data and make visuals, but with DAX, you can:
- Create custom KPIs (Key Performance Indicators)
- Design dynamic dashboards that adapt to filters/slicers
- Build advanced business logic
- Perform time intelligence like YTD/QTD/MTD
- Rank, segment, and group data in meaningful ways
Where is DAX Used in Power BI?
| Usage Area | What It Does | Example |
| Measures | Custom aggregations (KPIs, totals, ratios) | Total Sales = SUM(Sales[Amount]) |
| Calculated Columns | Add new columns based on row-wise logic | FullName = Customers[FirstName] & ” ” & Customers[LastName] |
| Calculated Tables | Generate filtered/virtual tables | Top5Products = TOPN(5, Products, [Total Sales]) |
| Row-Level Security | Custom logic for user access to specific data | UserAccess = [Region] = USERNAME() |
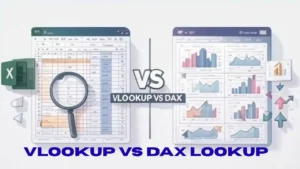
Read also: VLOOKUP vs DAX LOOKUP: A Complete Guide with 3 Best Examples

DAX is All About Context
1. Row Context
Applies to each row in a table, just like Excel.
✅ Used in calculated columns
Example:
TotalPrice = Sales[Quantity] * Sales[UnitPrice]
2. Filter Context
Comes from slicers, visuals, or CALCULATE()
✅ Used in measures
Example:
East Sales = CALCULATE(SUM(Sales[Amount]), Region[RegionName] = “East”)
Real-World Use Cases of DAX
✅ Use Case 1: Sales KPI
Problem: Show “High Performer” where sales > ₹50,000
Performance = IF(Sales[Amount] > 50000, “High”, “Low”)
📈 Use in: Conditional formatting, data labels, KPI cards
Read also: 4 SQL JOINs Explained Visually (With Real-World Examples) Best Guide for SQL Join
✅ Use Case 2: Sales by Product Category with Dynamic Filter
Sales by Category =
CALCULATE(SUM(Sales[Amount]),
Products[Category] = “Furniture”)
🔍 Use in: Visuals filtered to one category without user slicer
✅ Use Case 3: Time Intelligence – YTD Sales
YTD Sales = TOTALYTD([Total Sales], Calendar[Date])
📆 Use in: Line charts, time trend dashboards
✅ Use Case 4: Rank Top Products
Product Rank =
RANKX(ALL(Products), [Total Sales], , DESC)
🏆 Use in: Top N visuals, leaderboards
✅ Use Case 5: Dynamic KPI Selector using SWITCH
KPI Selected =
SWITCH(TRUE(),
KPITable[Selection] = “Total Sales”, [Total Sales],
KPITable[Selection] = “Profit Margin”, [Profit Margin],
KPITable[Selection] = “Units Sold”, [Total Units]
)
📊 Use in: One slicer for multiple KPIs
Read also: 7 Hidden Excel Tricks That Will Save You Hours of Work
Key DAX Functions You Must Know
| Function | What It Does | Example |
| SUM() | Adds column values | SUM(Sales[Amount]) |
| CALCULATE() | Changes context of a calculation | CALCULATE([Total Sales], Region = “West”) |
| FILTER() | Creates filtered tables (used in CALCULATE) | FILTER(Sales, Sales[Amount] > 10000) |
| ALL() | Removes filter context | CALCULATE([Total Sales], ALL(Products)) |
| IF() | Logical branching | IF([Sales] > 10000, “Yes”, “No”) |
| SWITCH() | Cleaner alternative to nested IFs | See above KPI example |
| RANKX() | Ranks values over a table | See product rank example |
| TOTALYTD() | Year-to-date aggregation | See YTD example |
| DIVIDE() | Safe division (avoids divide-by-zero) | DIVIDE([Total Sales], [Units Sold]) |
Common Beginner Mistakes
❌ Using CALCULATE() without understanding filter context
❌ Using calculated columns when measures are needed
❌ Forgetting to mark the date table for time intelligence
❌ Writing long DAX without VAR (variables)
🛠️ Practical Example: Creating Your First Measure
Goal: Calculate total revenue
Step-by-Step:
- Go to the “Sales” table
- Click “New Measure”
- Paste this:
Total Revenue = SUM(Sales[Amount])
- Drag this into a card visual → Done ✅
🧩 Practice Challenge
Create a measure that calculates sales for only “Delhi” region.
Delhi Sales = CALCULATE(SUM(Sales[Amount]), Region[RegionName] = “Delhi”)
Then create a measure to show:
“High” if Delhi Sales > ₹1,00,000, otherwise “Low”
Delhi Performance = IF([Delhi Sales] > 100000, “High”, “Low”)

💡 Power Tips for Mastering DAX
🔸 Use VAR to simplify long DAX
Profit Margin =
VAR Profit = [Total Sales] – [Total Cost]
VAR Margin = DIVIDE(Profit, [Total Sales])
RETURN Margin
🔸 Format your DAX: Improves readability
🔸 Always test with sample visuals
🔸 Use DAX Studio to analyze performance
✅ Summary: Why DAX Matters
| Feature | With DAX |
| Aggregations | Customized & flexible |
| Time-based logic | Simple with YTD, MTD, etc. |
| Advanced filters | Use CALCULATE + FILTER |
| Dashboard interactivity | Dynamic KPIs, top N, slicers |
| Performance | Efficient calculation model |